


According to new data analysis from the Topex/Poseidon and Jason-1 satellites, NASA is reporting that “warming water and melting land ice have raised global mean sea level 4.5 centimeters (1.7 inches) from 1993 to 2008.”
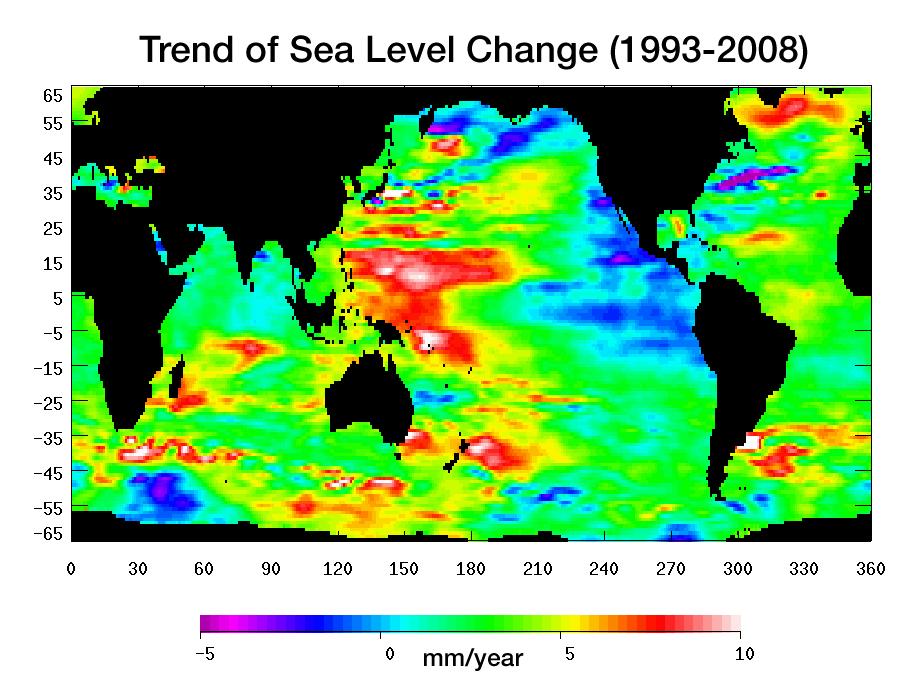
Here’s the image showing where and by how much the world’s oceans have changed over the last 15 years.
Light blue indicates areas in which sea level has remained relatively constant since 1993. White, red, and yellow are regions where sea levels have risen the most rapidly–up to 10 millimeters per year–and which contain the most heat. Green areas have also risen, but more moderately. Purple and dark blue show where sea levels have dropped, due to cooler water.
(Click image to enlarge)
This image was made possible by the detailed record of sea surface height measurements begun by Topex/Poseidon and continued by Jason-1. The recently launched Ocean Surface Topography Mission on the Jason-2 satellite (OSTM/Jason-2) will soon take over this responsibility from Jason-1.