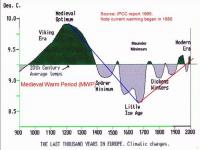
High Scientific Style Courtesy of Dr. Tim Ball

authordefault
on

This contest was clearly too easy. As the first respondent pointed out, I telegraphed the answer by calling the author of this graph, Dr. Timothy F. Ball, a “distinguished” Canadian climatologist. it seems that sarcasm CAN translate to the printed page once in a while.

The graph, complete with a trend line from the top of one peak to the bottom of the next valley, was taken from a lecture that Ball gave to the Winnipeg-based Frontier Centre for Public Policy, which can be found here.

Regardless of the “credit etched on the graph,” I have not been able to find anything quite like it in the 1995 IPCC report.

So, if Steve Bloom and Geoff would like to send us their size and address, we’ll pop a couple of DeSmog t-shirts in the mail.

Related Posts

on

An upcoming city policy review offers the best chance to drop “fundamentally misleading” ads designed to appeal to policy makers and consumers.

An upcoming city policy review offers the best chance to drop “fundamentally misleading” ads designed to appeal to policy makers and consumers.
on

A new Environmental Defence analysis reveals that despite government promises to cut, the amount of taxpayers’ money given to the industry remains high.

A new Environmental Defence analysis reveals that despite government promises to cut, the amount of taxpayers’ money given to the industry remains high.
on

The American Fuel & Petrochemical Manufacturers, a major oil refining group, is once again behind a push to keep cars running on oil.

The American Fuel & Petrochemical Manufacturers, a major oil refining group, is once again behind a push to keep cars running on oil.
Analysis
on

"Climate the Movie" portrays today’s climate denier agenda by rehashing the same old fossil fuel talking points and trolling the left.

"Climate the Movie" portrays today’s climate denier agenda by rehashing the same old fossil fuel talking points and trolling the left.