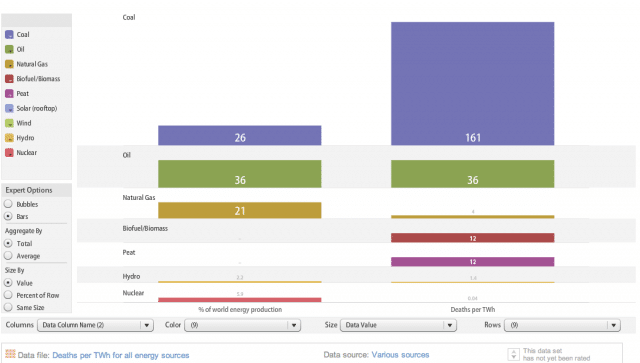
How deadly is your energy source? The very real and lethal effects of our global energy choices become clear in this interactive data visualization, showing the death rate, as measured by the number of deaths per terawatt hour (TWh), for each of the major global energy sources, e.g., coal, natural gas, oil, nuclear, hydro, peat, and biomass. Take a closer look at the chart here:
Click on the image to view the full size.
The left column displays the percentage of world energy production for each energy source while on the right you can see the corresponding number of attributed deaths per terawatt hour.
To give some perspective to the value of a terawatt hour: “All wind turbines installed by the end of 2009 worldwide are generating 340 TWh per [year], equivalent to the total electricity demand of Italy, the seventh largest economy of the world, and equaling 2 percent of global electricity consumption,” according to a report the World Wind Energy Association published last year (PDF). Meanwhile, wind energy’s cumulative death rate is 0.01 deaths/TWh (.xls file), based on 44 deaths since 1975, which Paul Gipe, author of Wind Energy Comes of Age, calculated in 2010.
This data visualization comes via IBM’s research site, Many Eyes, where you can click through to interact with the data. It doesn’t show here the data for solar (rooftop’s 0.44 deaths/TWh) or wind, which the original source has claimed both have a higher number of deaths per TWh than nuclear (0.04 deaths/TWh). However, this doesn’t take into account the most recent calculations for wind energy (0.01 deaths/TWh), making wind – and not nuclear – the least deadly energy source based on these metrics.
Coal, unsurprisingly, comes out the deadliest energy source, due to the clear health impacts of air particulate pollution. All the more reason the Environmental Protection Agency should be strictly regulating coal power’s many hazardous air pollutants.
Nuclear energy’s low death rate may seem somewhat surprising because of its pervasively toxic stigma (Homer Simpson working at a nuclear plant controls? – radiation! meltdown! Chernobyl!). However, the low rate here is likely due in part to the fact that nuclear supplies a larger chunk of energy worldwide in comparison to say, solar, and that deaths associated with nuclear energy are harder to link directly because the adverse and fatal effects can develop over a much longer period of time (e.g., cancer). Deaths from solar (rooftop, anyway) tend to be from falling accidents during installation and maintenance on roofs and shouldn’t be dismissed in the push for clean energy because these deaths are easily preventable.
Hat tip to GOOD for highlighting the chart.
Image: Many Eyes
Subscribe to our newsletter
Stay up to date with DeSmog news and alerts


