By Zeke Hausfather, Carbon Brief. Originally posted on Carbon Brief, CC BY–NC–ND 4.0
In the 2015 Paris Agreement on climate change, nearly every country on Earth pledged to keeping global temperatures “well below” 2C above pre-industrial levels and to “pursue efforts to limit the temperature increase even further to 1.5C”.
However, at the time, scientists had only modeled energy system and carbon mitigation pathways to achieve the 2C target. Few studies had examined how the world might limit warming to 1.5C.
Now a paper in Nature Climate Change presents the results from a new modelling exercise using six different “integrated assessment models” (IAMs) to limit global temperatures in 2100 to below 1.5C.
The results suggest that 1.5C is achievable if global emissions peak in the next few years and massive amounts of carbon are sucked out of the atmosphere in the second half of the century through a proposed technology known as bioenergy with carbon capture and storage (BECCS).
Defining the 1.5C Target
One challenge with the goal of limiting warming to 1.5C above pre-industrial levels is that it was not clearly defined in the text of the Paris Agreement. For example, scientists disagree on what, exactly, pre-industrial temperatures were and how best to define them, as well as what dataset to use.
There is also not a clear consensus if the target should be to aim to have even odds of the world reaching 1.5C warming by 2100, or seek to try and avoid having temperatures exceed 1.5C by aiming for an even lower warming amount. Because uncertainties in climate sensitivity mean that we could have anything between 1.5C and 4.5C warming per doubling of CO2 emissions, scientists tend to plan to avoid the worst case where climate sensitivity ends up being on the higher end of the range.
In the case of the 2C target, the Paris Agreement’s “well below” language has been interpreted as ensuring that there is no more than a 33% chance of exceeding 2C — and, therefore, a 66% chance of staying below it. But the 1.5C target could be interpreted as either aiming for a 50% chance of staying below 1.5C, or a 66% chance similar to the 2C target. This may sound like a small distinction, but it has large impacts on the resulting carbon budget and ease of meeting the target.
In their new paper, a team of 23 energy researchers choose the stricter interpretation of the target, aiming for a 66% chance of avoiding more than 1.5C warming in the year 2100. However, they allow for temperatures to exceed 1.5C over the course of the century as long as they fall back down to below 1.5C by the year 2100. This is known as an “overshoot” scenario.
1.5C Only Possible in Some Future Pathways
To assess viable pathways to limit warming to 1.5C, the researchers use the new Shared Socioeconomic Pathways (SSPs) developed in preparation for the next Intergovernmental Panel on Climate Change (IPCC) assessment report due early next decade. These SSPs — which Carbon Brief will explore in more depth in the coming weeks — present five possible future worlds that differ in their population, economic growth, energy demand, equality and other factors.
Each world could have multiple different climate trajectories, though some will have a much easier time reducing emissions than others. The new climate trajectory associated with avoiding more than 1.5C warming in 2100 is called Representative Concentration Pathway 1.9 (“RCP1.9”), which is a world where the radiative forcing from greenhouse gases is limited to no more than 1.9 watts per meter squared (W/m2) above pre-industrial levels. This is lower than the range of RCPs previously used by climate modellers, which went from 2.6 up to 8.5W/m2.
The six IAMs all find viable 1.5C scenarios in SSP1, which is a pathway that focuses on “inclusive and sustainable development”. Four of the six models find pathways in SSP2, which is a middle of the road scenario where trends largely follow historical patterns. No models show viable 1.5C pathways in SSP3, which is a world of “regional rivalry” and “resurgent nationalism” with little international cooperation.
Finally, only one of the models has a 1.5C pathway in SSP4, which is a world of “high inequality”, while two models have viable pathways in SSP5, a world of “rapid economic growth” and “energy intensive lifestyles”.
Emissions Must Peak Quickly
To limit warming to below 1.5C, all the models that the researchers examined require that global emissions peak by 2020 and decline precipitously thereafter. After 2050, the world must reduce net CO2 emissions to zero and emissions must be increasingly negative throughout the second half of the 21st century.
Even with these rapid reductions, all the scenarios considered still overshoot 1.5C warming in the 2040s, before declining to around 1.3-1.4C above pre-industrial levels by 2100. Models with more rapid reductions — generally associated with SSP1 — have less temperature overshoot than those with more gradual reductions.
The figure below shows both CO2 emissions (left) and global warming above pre-industrial (right) across all the 1.5C models examined. The lines are coloured based on the SSP used.
CO2 emissions in gigatons (Gt) CO2 (left) and global mean surface temperature relative to preindustrial (right) across all RCP1.9/1.5C scenarios included in Rogelj et al 2018. Data available in the IIASA SSP database. Chart by Carbon Brief using Highcharts.
The models show a remaining 1.5C “carbon budget” from 2018 to 2100 of between -175 and 400 gigatonnes of CO2 (GtCO2). This range is consistent with estimates from the IPCC’s 5th Assessment Report.
The wide range is largely a result of differences in emissions of non-CO2 greenhouse gases, such as methane and nitrous oxide, which vary by a factor of between two and three across the models by 2100. Some models with higher non-CO2 emissions have a remaining carbon budget of less than zero, requiring more CO2 to be removed from the atmosphere than added by the end of the century. In these simulations, the carbon budget for 1.5C has already been used up.
The central estimate across the models is that the remaining 2018-2100 carbon budget is around 230 GtCO2. At the current rate of emissions, this would allow roughly six years until the entire 1.5C budget is exhausted, with a range of zero to 11 years across all the models.
Replacing Fossil Fuels With Renewables
The study explores the different ways that global energy needs can be met, while also cutting GHG emissions in order to meet the 1.5C goal. Limiting warming to below 1.5C requires that the world rapidly phase out all types of fossil fuels — or at least those without accompanying carbon capture and storage (CCS). At the same time, the world need to quickly ramp up the use of zero and net-negative carbon energy sources — things such as BECCS that generate energy while actually removing CO2 from the atmosphere.
The figure below shows the use of renewables (left), net-negative BECCS (centre) and coal without CCS (right) across all the 1.5C models. The colours show which SSPs the model simulations use.

Global primary energy use in exajoules (EJ) for non-biomass renewables (left), BECCS (center), and coal without CCS (right) across all RCP1.9/1.5C scenarios. Adapted from Figure 2 in Rogelj et al 2018.
In most models, overall energy use actually increases between 2018 and 2100, by between -22% and +83%, with a central increase of 22%.
However, the models also show that energy efficiency is quite important in the short term — at least, while most energy comes from fossil fuels. This is particularly important in the transportation and building sectors, where rapid decarbonisation is more difficult than in power generation.
The models show an estimated 60-80% of all energy coming from renewables globally by 2050. Some models also show a much larger role for nuclear power, though others do not.
To limit warming to 1.5C, coal use without carbon capture declines by around 80% by 2040, with oil similarly mostly phased out by 2060. This would require most petrol or diesel vehicles to be phased out by 2060, with electric or other low-carbon alternative fuel vehicles making up the vast majority of sales well before that date. Future natural gas use is more mixed in the models, with some showing increases and some decreases by mid-century.
Emissions Must Go Negative
Negative emissions are needed in the latter half of the century to pull the extra CO2 out of the atmosphere. This is because emissions cannot fall fast enough in the models to avoid exceeding the allowable carbon budget to avoid 1.5C warming.
Most of the models emit roughly 50-200% more CO2 than the allowable carbon budget over the course of the century, before pulling the extra CO2 back out.
The models assume widespread adoption of BECCS starting between 2030 and 2040 and then rapidly scaling up. By 2050, many models have BECCS producing more than 100 exajoules (EJ), roughly the same amount of energy globally as coal provides today. By 2100, BECCS will be around 200EJ compared to 300EJ for all non-biomass renewable energy.
The figure below shows the amount of CO2 sequestered by CCS (both from BECCS and fossil fuels) across all the models. Carbon capture ramps up after 2020 and could be 20 GtCO2 or higher by the end of the century, which is around half of global CO2 emissions in 2018.
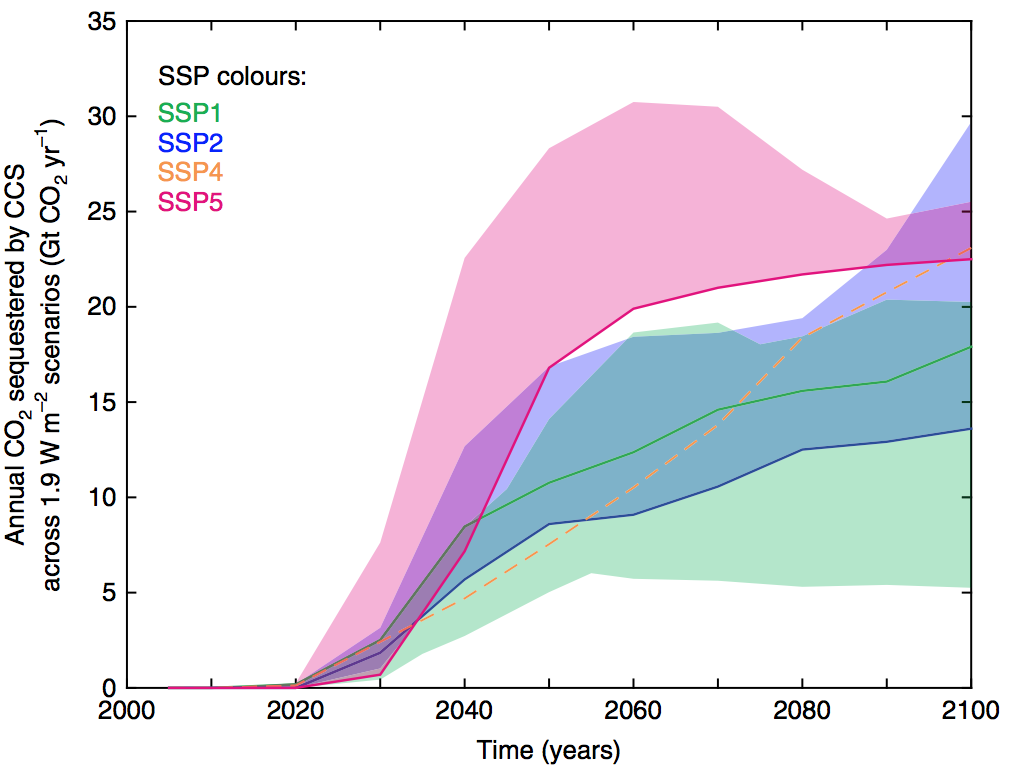
Annual CO2 sequestered by carbon capture and storage in gigatons (Gt) CO2 by year and SSP across all RCP1.9/1.5C scenarios. Adapted from Figure 3 in Rogelj et al 2018.
The models produce estimates of global forest cover changes between -2% and 26% between today and 2100, with most models showing significant increases in forest cover. Both BECCS and afforestation require a lot of land. Most models show a decline in global cropland scenarios roughly equal to the area currently used for agriculture across the entire European Union.
However, most of the models used in the study do not include afforestation as an explicit mitigation option, so afforestation and other “natural” negative emissions technologies could potentially play a larger role in the future. The specific technologies used for future negative emissions may be different and somewhat less reliant on BECCS, but non-BECCS approaches are largely excluded from the models due to remaining uncertainties in cost and effectiveness at scale.
Similarly, the amount of BECCS used differs quite a bit between models and across SSPs, with SSP1 requiring the least negative emissions and SSP5 requiring the most due to its slower emissions reductions and higher overall energy use.
Dr Joeri Rogelj, the paper’s lead author from the International Institute for Applied Systems Analysis (IIASA) in Austria, tells Carbon Brief:
“This indicates that a focus on sustainable lifestyles that limit energy demand can strongly reduce the reliance on BECCS.”
One interesting consequence of the 1.5C target is a reduced use of fossil fuels combined with CCS, compared to what is found in 2C scenarios. This is because fossil fuels with CCS still results in methane emissions from coal mining or gas handling, as well as CO2 emissions due to imperfect capture and leakage. These extra emissions can become too important to allow at a large scale in a 1.5C world.
Much More Difficult to Reach 1.5C Than 2C
In addition to exploring the details of what it would take to limit warming to 1.5C, the paper also compares it to existing 2C scenarios across a number of different categories. The figure below shows the difference between 1.5C and 2C scenarios across both economic and CO2 reduction metrics. Each dashed line represents a 100% increase in cost or effort in a 1.5C world compared to a 2C world.
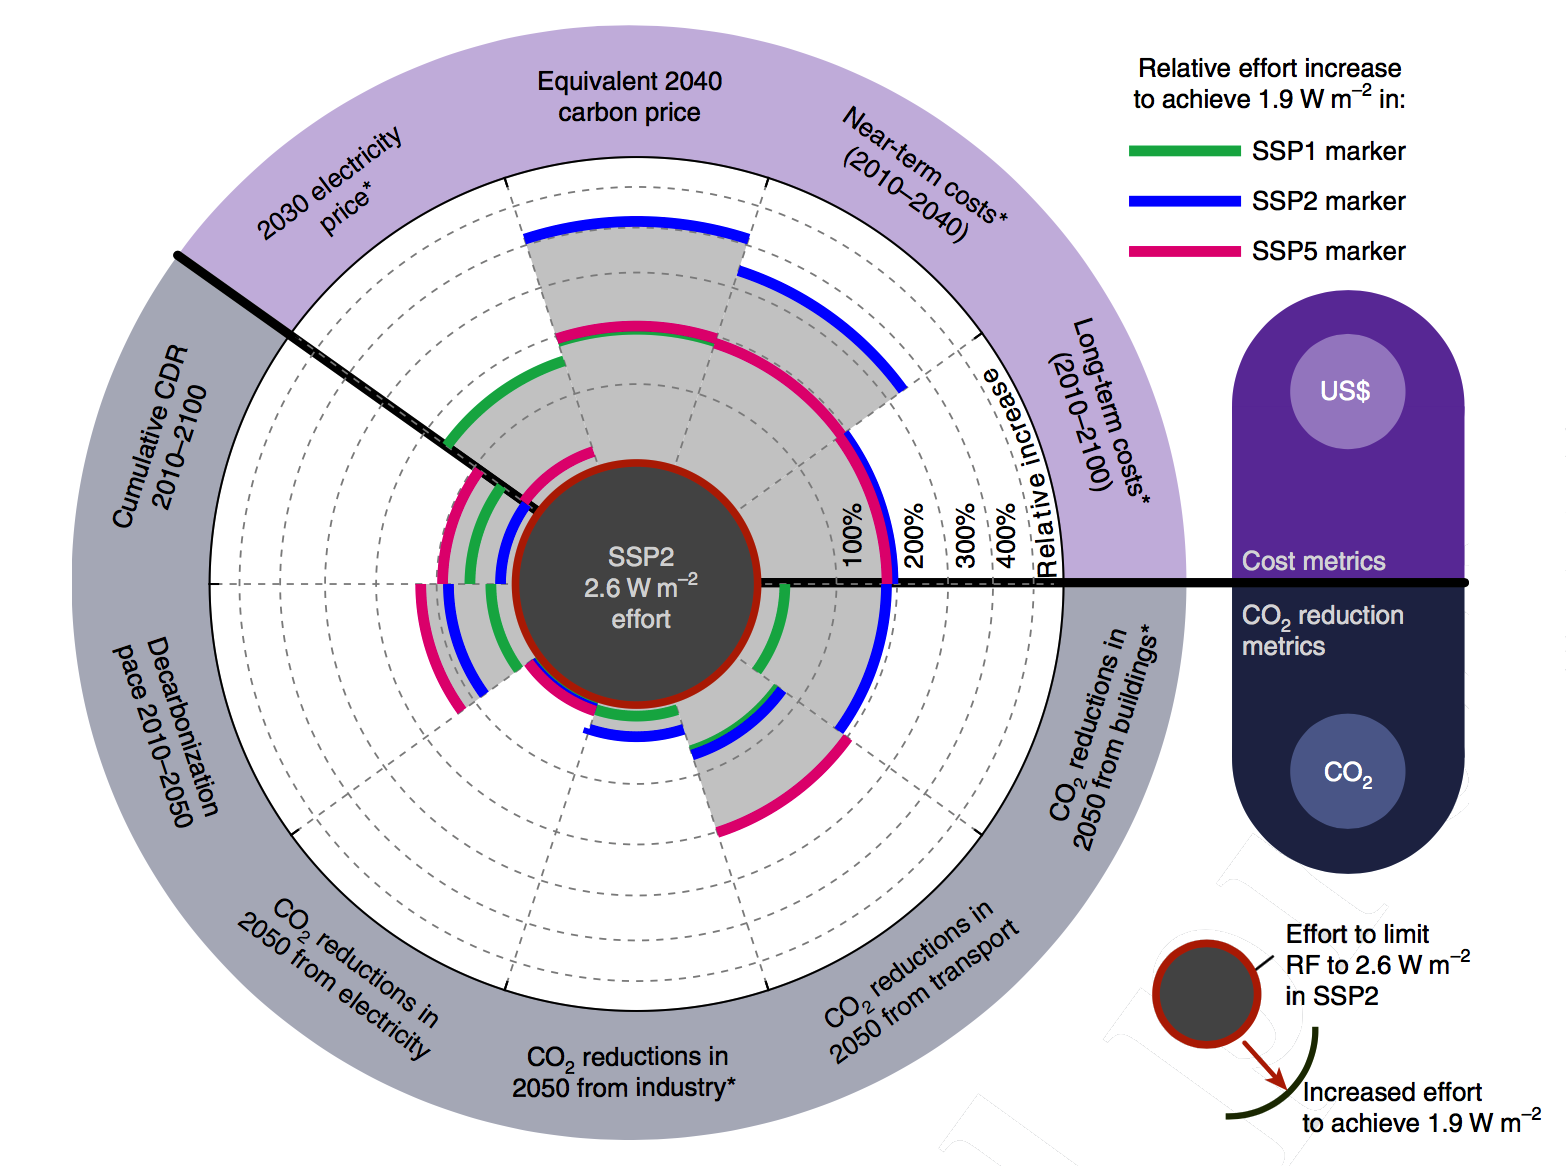
Relative increases in cost and CO2 reduction metrics for 1.5C scenarios compared to 2C scenarios for various SSPs. Each dashed line represents a 100% increase in cost or reduction amount, up to a 500% increase. Taken from figure 4 in Rogelj et al 2018.
The largest increases are in carbon prices, which must be between 200% and 400% higher, and in near-term costs, which are 200% to over 300% higher. These increases in short-term costs are driven by the more severe near-term emission reductions needed. Long-term costs are also expected to be around 200% higher.
For CO2 reduction metrics, a 1.5C world requires approximately two to three times larger reductions in CO2 from buildings and transport than in a 2C world. These sectors are more difficult to decarbonise than power generation as they involve the direct combustion of fossil fuels that are less easily replaced.
Difficult, But Possible?
The new scenarios in this study are important because they show that there are possible trajectories and technological pathways that can limit warming to below 1.5C in 2100. However, all of the models included overshoot 1.5C of warming in the middle of the century. Most also rely on massive amounts of still-unproven negative emissions later in the century to allow a more feasibly gradual reduction in emissions in the near-term.
As Dr Glen Peters, a senior researcher at the CICERO Center for International Climate Research in Norway who was not involved in the study, tells Carbon Brief:
“Limiting temperature to 1.5C is getting close to what models can deliver, with only certain socioeconomic, technological and resource assumptions amenable to 1.5C pathways. How to transform the model results into a viable society transformation remains the elephant in the room. The 1.5C scenarios require radical reductions in unabated fossil fuel use, rapid expansion of non-fossil energy sources and planetary-scale carbon dioxide removal. Failing to meet any of those core building blocks will make 1.5C quickly infeasible.”
Note: Accompanying the publication of the study is a newly updated SSP emissions and scenario database, which includes data for all SSP scenarios.
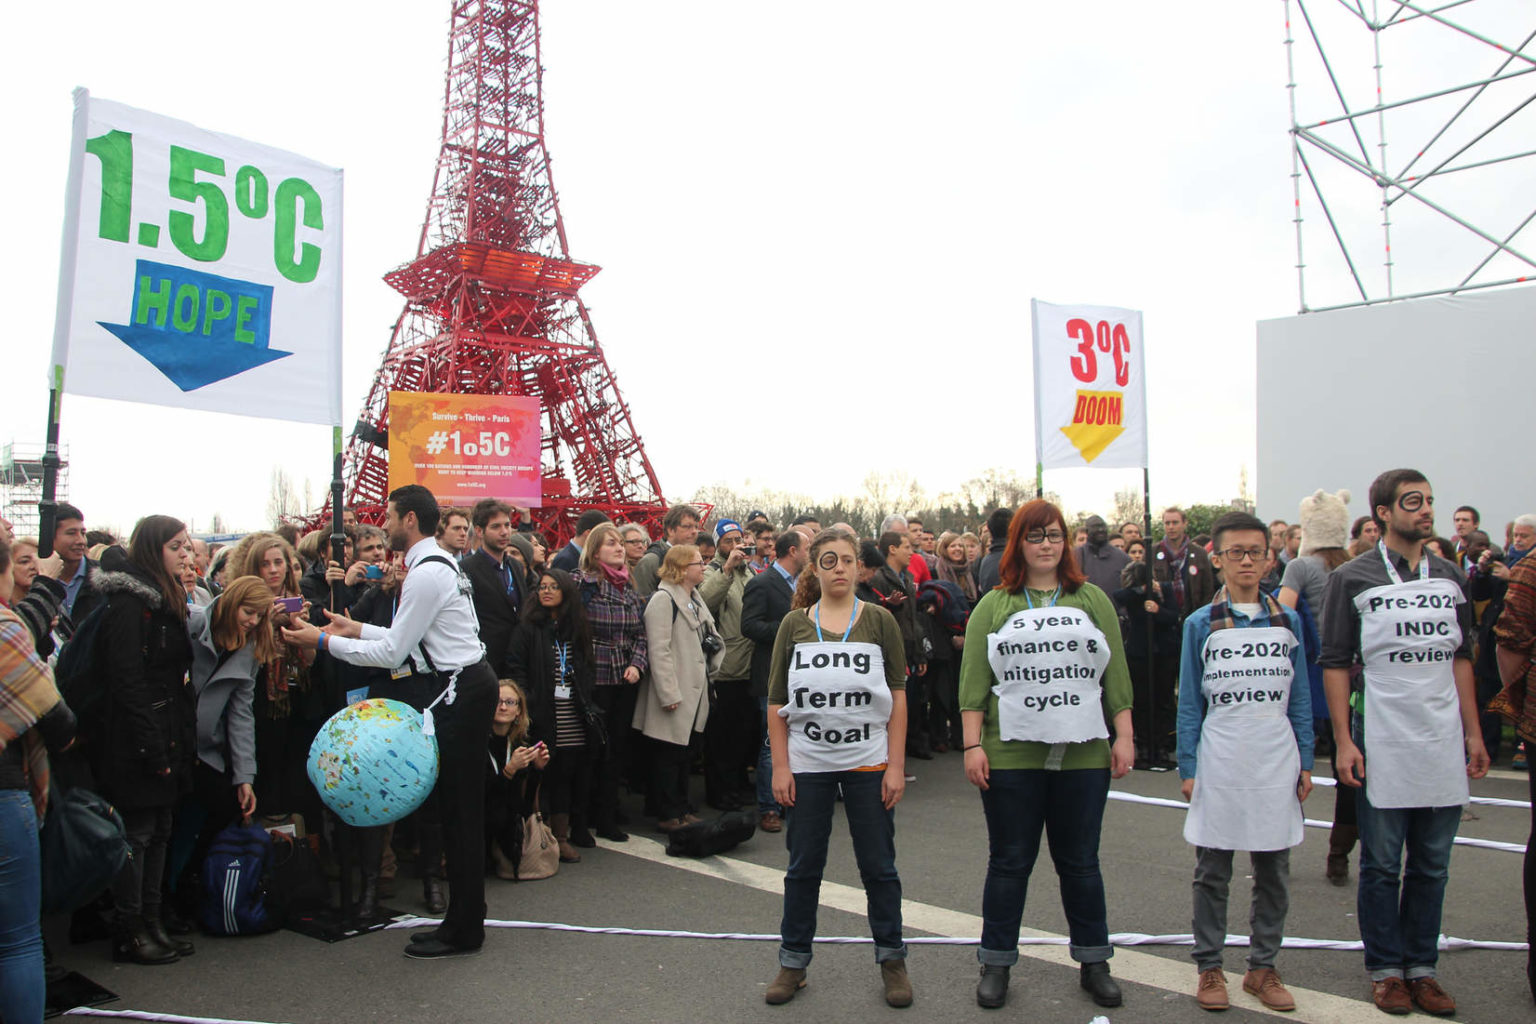
Main image: Activists rally around a 1.5C pathway to limit global warming during the 2015 United Nations climate summit in Paris. Credit: Takver, CC BY–SA 2.0
Subscribe to our newsletter
Stay up to date with DeSmog news and alerts


